Experiment Design Model
The cell array research can be organized in three-level hierarchical data model, as shown in the diagram and explanations below.
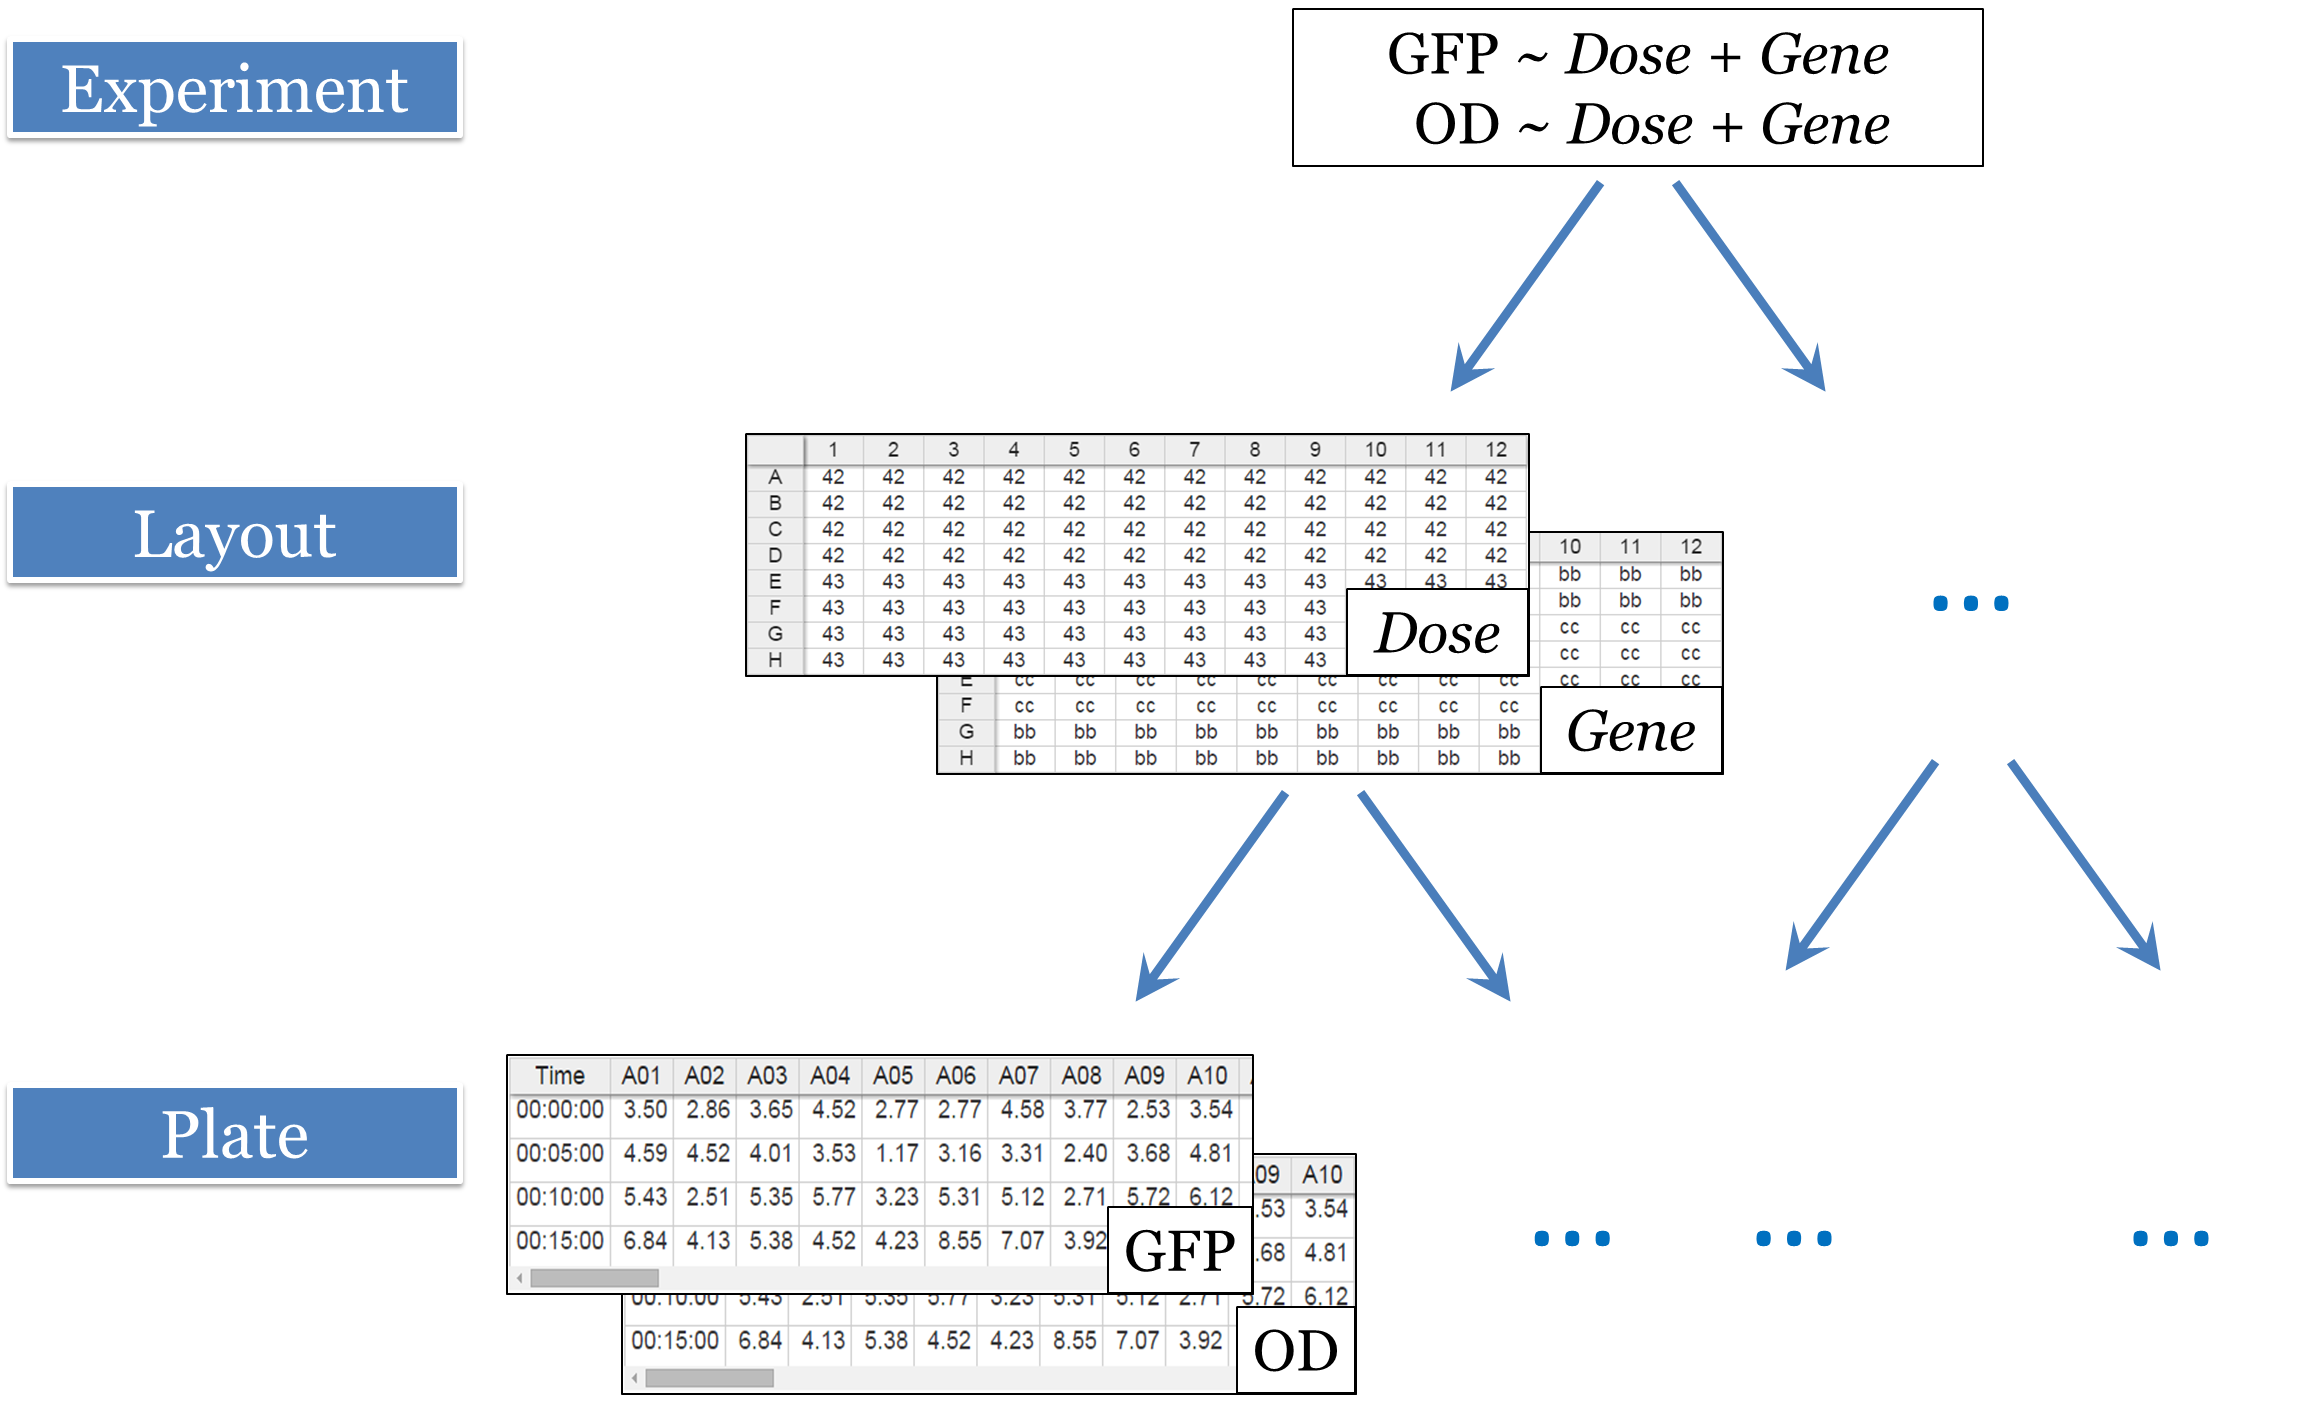
Figure 1. Three level data model.
The notations used in the diagram is explained in the following table:
| Symbol | Meaning |
|---|---|
| Dose, Gene, ... | Factors (independent variables) |
| GFP, OD, ... | Channels (dependent variables) |
| GFP ~ Dose + Gene | Statistical formula. This particular formulae can be interpreted as “GFP is modeled as a function of Dose and Gene ” |
1. Experiment
A single experiment aims to answer one question: how different factors (independent variables) influence channels (dependent variables). The experiment information consists experiment name, user and number of wells for microplates, as well as meta information about factors and channels.
2. Layout
A unique layout is determined by the specific combination of factors in all the wells. As an example, the Factor information associated with a particular layout could be seen as:
| Well | Factors | Level |
|---|---|---|
| A01 | Gene | ‘aa’ |
| A02 | Gene | ‘bb’ |
| ... | ... | |
| H12 | Gene | ‘dd’ |
| A01 | Dose | 10.00 |
| A02 | Dose | 1.00 |
| ... | ... | |
| H12 | Dose | 1.00 |
3. Plate
A unique plate is foundamental unit of experimetn. Plate information includes the experiment measures. As an example, the Channel information associated with a particular plate can be seen as:
| Well | Channels | Time | Value |
|---|---|---|---|
| A01 | GFP | 00:00:00 | 10.00 |
| A01 | GFP | 00:00:05 | 20.00 |
| ... | ... | ... | ... |
| H12 | GFP | 02:00:00 | 25.00 |
| A01 | OD | 00:00:00 | 0.10 |
| A01 | OD | 00:00:05 | 0.20 |
| ... | ... | ... | ... |
| H12 | OD | 02:00:00 | 1.00 |